Process Explorer (ProcExp) Tutorial
I created a tutorial for Process Explorer (ProcExp) to help me practice my skills for an upcoming interview to be a Sr Solutions Architect at Microsoft. Process Explorer is a tool within the Windows Sysinternals utilities that shows information about which handles and DLLs processes have opened or loaded. This tutorial covers a variety of topics, including how to start ProcExp in administrative mode, how to find running processes and those that close quickly, how to understand threads with Service Host (svchost.exe), and how to hunt for a virus. I also cover how to enable additional columns in ProcExp, and how to save column sets for future use. This tutorial helped me develop my technical skills and become more familiar with the Sysinternals toolkit.
Process Explorer (ProcExp) Overview
Process Explorer shows you information about which handles and DLLs processes have opened or loaded. This is the most downloaded tool of the Sysinternals toolkit, with over 3 Million downloads a year.
Process Explorer is a part of Windows Sysinternals which is a set of utilities to manage, diagnose, troubleshoot, and monitor Windows. Sysinternals was originally created in 1996 by Winternals Software and was started by Bryce Cogswell and Mark Russinovich. Microsoft acquired Winternals on July 18, 2006, which included Sysinternals and the utilities within it.
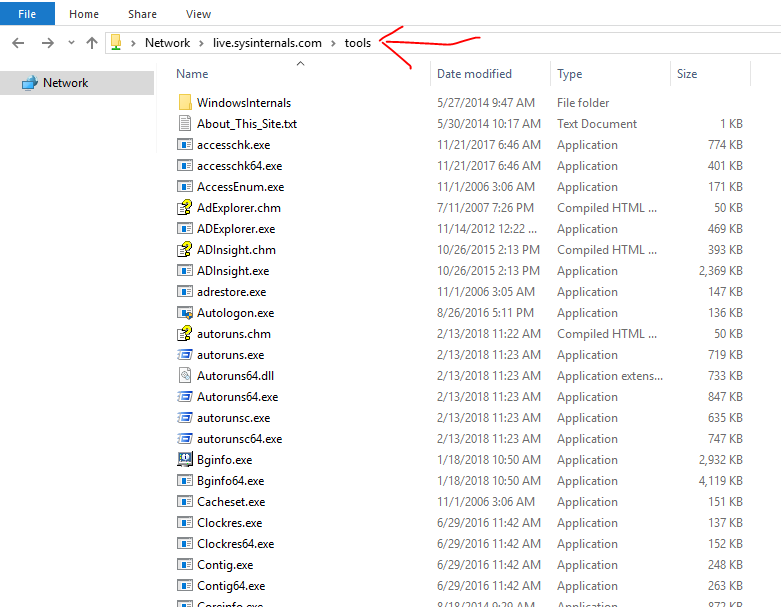
The set of tools is now available on any Windows computer by opening \\live.sysinternals.com\tools\ in a file explorer. This UNC path is a service provided by Microsoft and is referred to as Sysinternals Live.
Starting Process Explorer
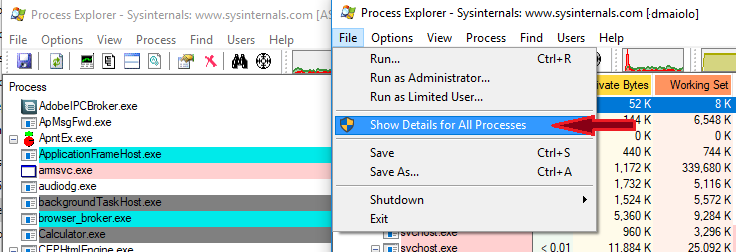
I recommend starting ProcExp.exe from an elevated command prompt, so that it opens in administrative mode. If you start ProcExp in standard mode, you’ll notice it has extra options to Show Details for All Processes:
Also, if you every have issues opening ProcExp, you should clear its registry key at HKEY_CURRENT_USER\Software\Sysinternals.
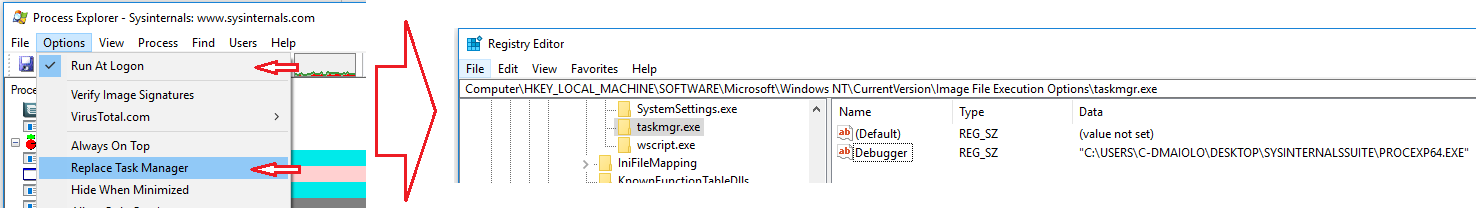
One of the most useful ways to run ProcExp is before logon, or as a replacement to Task Manager. When you select to have process explorer replace task manager, it is actually making use of the Image File Execution Options which replaces taskmon.exe with procmon.exe.
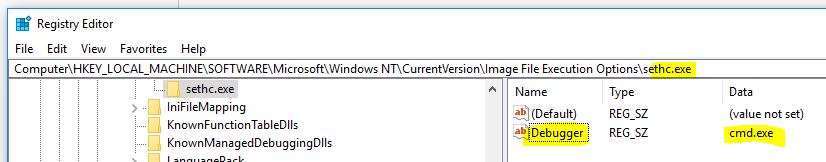
Another useful way to start ProcMon is at the Windows Logon Screen (CTRL+ALT+DEL). You can do this by adding an Image File Execution Option for Sticky Keys (sethc.exe) and have it open cmd.exe. Once at the logon screen, press Shift 5 times and cmd.exe will open where you can run process explorer. This is useful to diagnose headless servers, etc.
Views in ProcExp
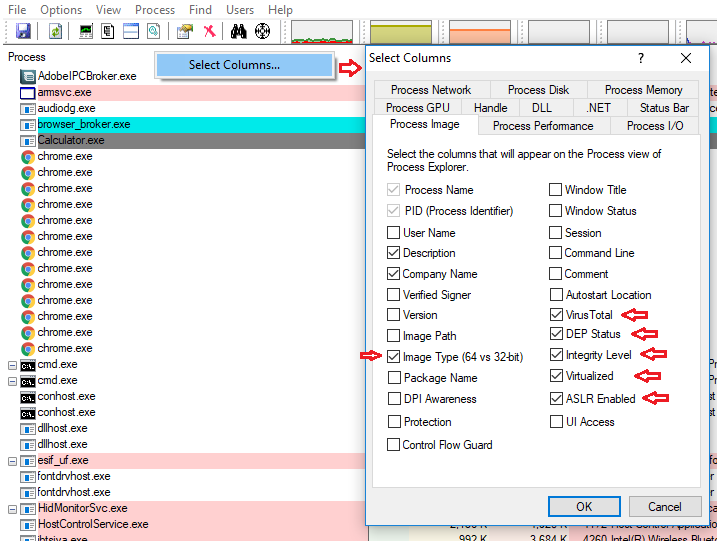
You can enable several additional columns in process explorer. To do this, right click on the columns and click Select Columns. In this example I have chosen columns that would help with debugging malware:
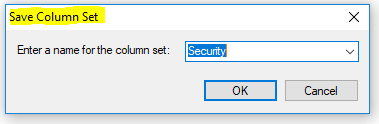
You can then choose to save the column set for future use by selecting View -> Save Column Set
Now, if you create multiple Column Sets you can toggle between them by entering CTRL+1, CTRL+2, etc.
Finding Running Processes
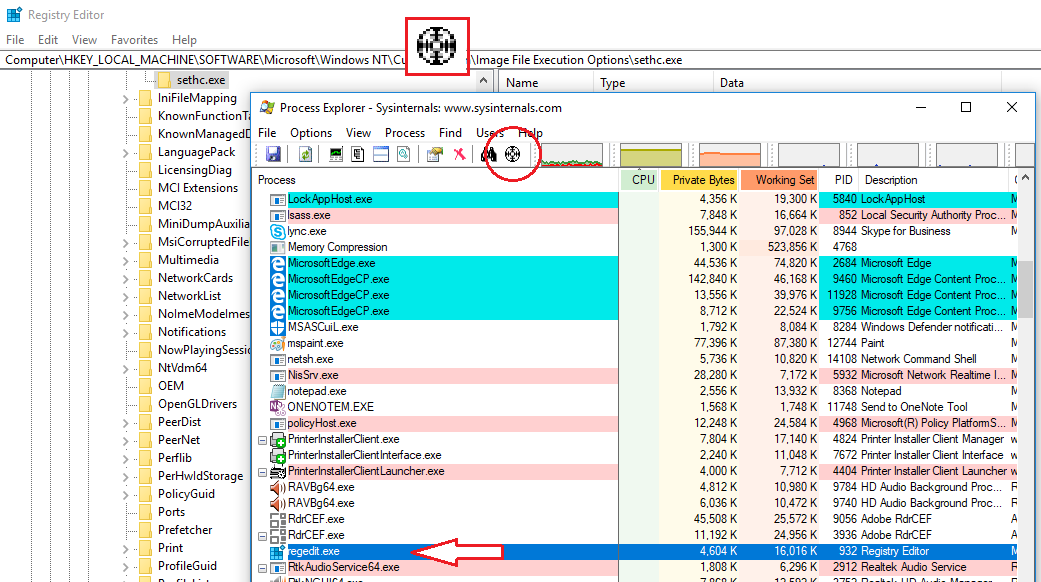
One of the best ways to determine what process a certain application is, you can use the target tool to click it, and the process will become highlighted. In this example, I click the Registry Editor
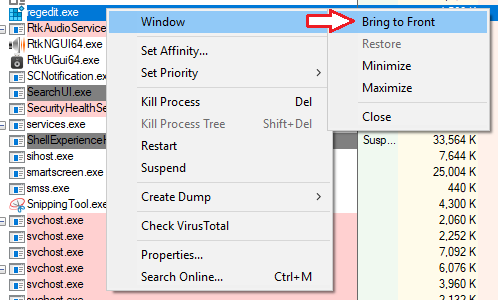
You can also reverse this process by right clicking a process and selecting to bring it to the front:
Finding Processes That Close Quickly
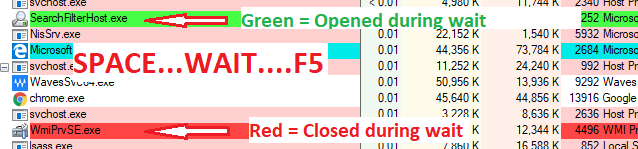
If you are trying to track down a process that is only very briefly popping up or closing quickly, there is a trick to see what processes might be doing this. To see them, first pause ProcExp by hitting the Space Key. Now, wait for the process to pop up on the screen, and then hit F5. Now, in ProcExp all new processes between the time you hit Space and F5 will be highlighted:
Threads and Stacks
Because Task Manager cannot see Threads and Stacks, this is one of the best uses of ProcExp. In a CPU core, only threads run. Processes are more like buckets that contain many threads to run that are given their own memory allocation, etc. Stacks are integral to a thread and represents the stack of instructions in the memory that is associated to the thread running. Stacks are just like a stack of plates where you can Pop and Push items off the stack.
Understanding Threads with Service Host (svchost.exe)
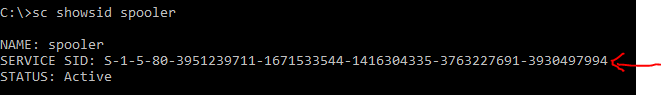
If you wanted to know why a process crashed or is using a lot of memory, it could be any one of the threads within it causing the problem. For example Service Host (svchost.exe), the process that runs all services, is one of the most common processes to eat up memory. Many Service Hosts run on a modern Windows OS, because the granularity to have svchost.exe run with different permissions has increased as security has increased and the need to separate processes from a service if a service needed to be stopped. This introduced things like Service SIDs and Service Privileges. For example, to get an access token you need a Service SID. To view the Service SID associated to a Service, you can find it with
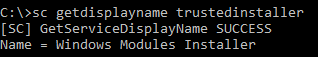
sc showsid <servicename>
For example, you might know that Trusted Installer owns everything in Windows, but Trusted Installer is actually the Windows Module Installer Service:
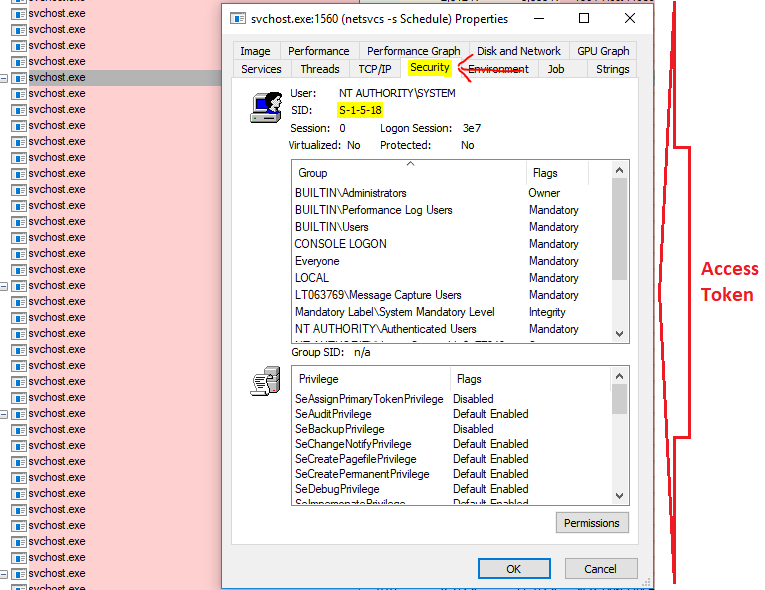
Back to ProcExp, we can view the Access Token and privileges associated to the svchost running by going to Properties, then the Security tab:
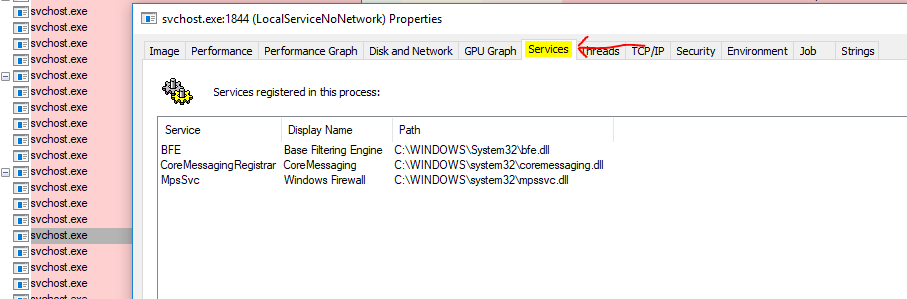
Next, then look at the Services tab which will show you the Binaries that are associated to the services running under the svchost you selected.
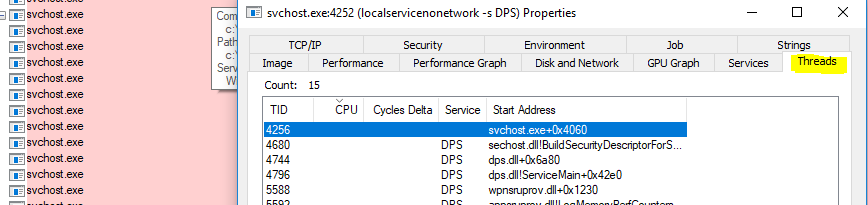
Finally, we can view the threads running in the svchost selected to try and debug exactly what might be causing a hang, etc.
As a note, a computer running Windows 10 1703 and above, with more than 3,484 MB of RAM, will have every service placed in its own Service Host (svchost.exe). This should make debugging Services a little bit easier.
Hunting for a Virus
First, choose the process you think might be associated to the virus. To do this, you can either look at which process is consuming the most CPU, but also you Verify Image Signatures and Check VirusTotal.com for relations to the process with a virus.
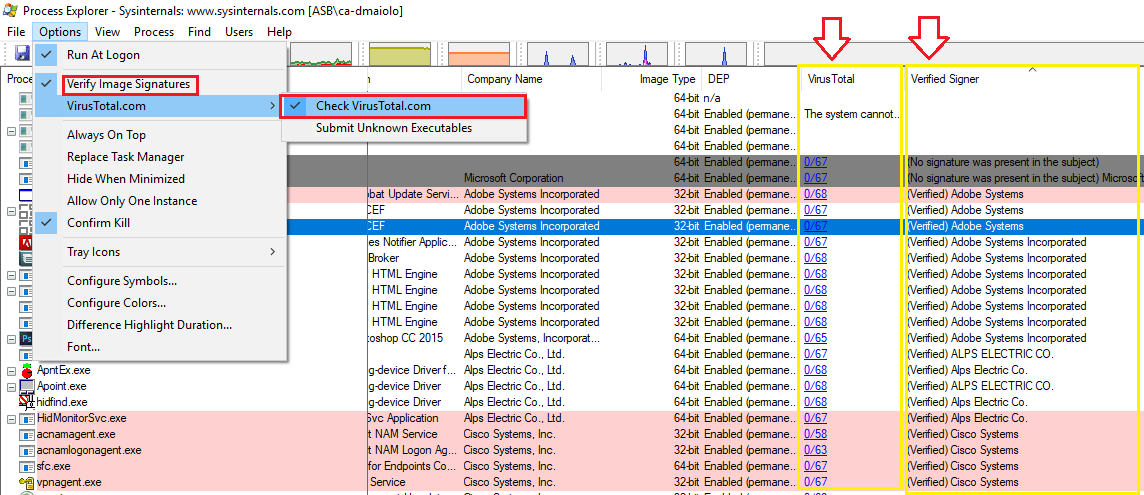
If the Signer is not verified, it doesn’t mean that it is a virus, but it warrants more investigation. The VirusTotal column shows if any engines found the hash value of the executable associated to something malicious.
Resource Usage in ProcExp
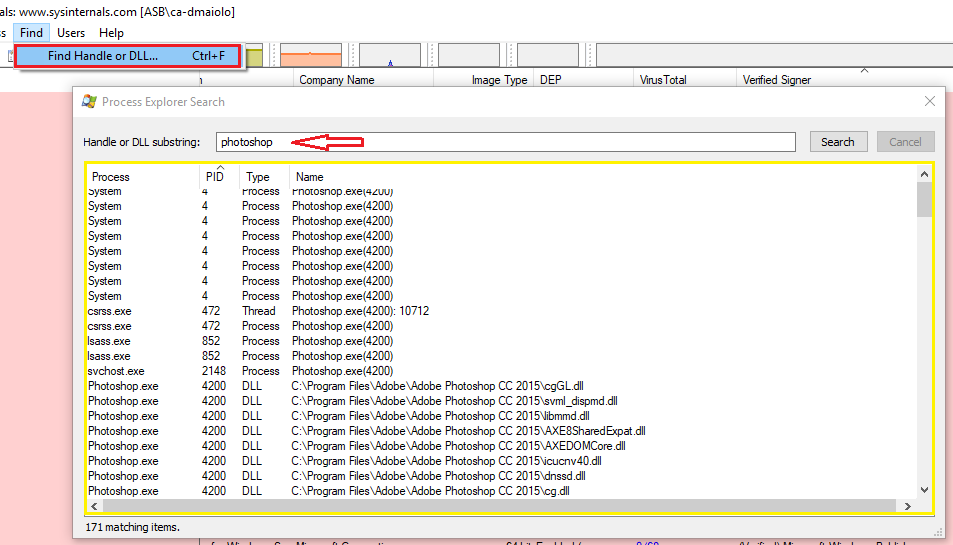
Another great use of ProcExp is determining what handles are open for a process. For example, if you wanted to see any process that had a handle on PhotoShop, click Find -> Find Handle or DLL which will allow you to find the processes, threads and DLLs associated:
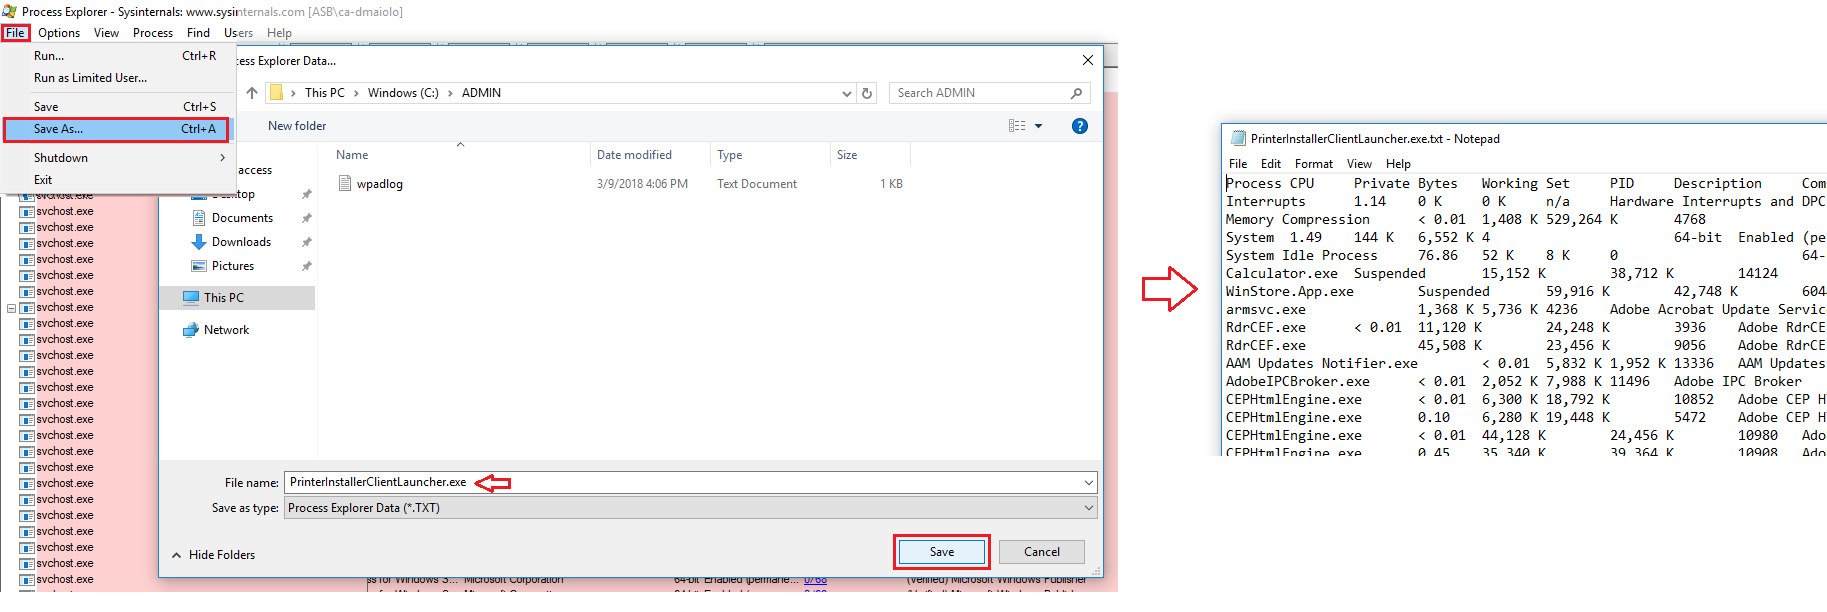
Saving ProcExp Data
You can save a snapshot of the current data by selecting File -> Save As which will save a text file of the current view, with expanded details on the process you had highlighted: