Process Monitor (ProcMon) Tutorial
In this tutorial, I provide an overview of Process Monitor (ProcMon), a powerful Windows monitoring tool. I explain how to start and filter ProcMon, find changed values, enable boot logging, and run ProcMon against a remote machine. I created this tutorial to practice key concepts for my upcoming interview for the Senior Solutions Architect position at Microsoft. By mastering ProcMon and other tools in the Windows Sysinternals suite, I was able to showcase my troubleshooting and diagnostic skills to the Microsoft hiring team.
Process Monitor (ProcMon) Overview
Process Monitor is a monitoring tool for Windows that shows live file, Registry and process/thread activity. It is a combination of two older Sysinternals utilities, Filemon and Regmon.
Process Monitor is a part of Windows Sysinternals which is a set of utilities to manage, diagnose, troubleshoot, and monitor Windows. Sysinternals was originally created in 1996 by Winternals Software and was started by Bryce Cogswell and Mark Russinovich. Microsoft acquired Winternals on July 18, 2006, which included Sysinternals and the utilities within it.
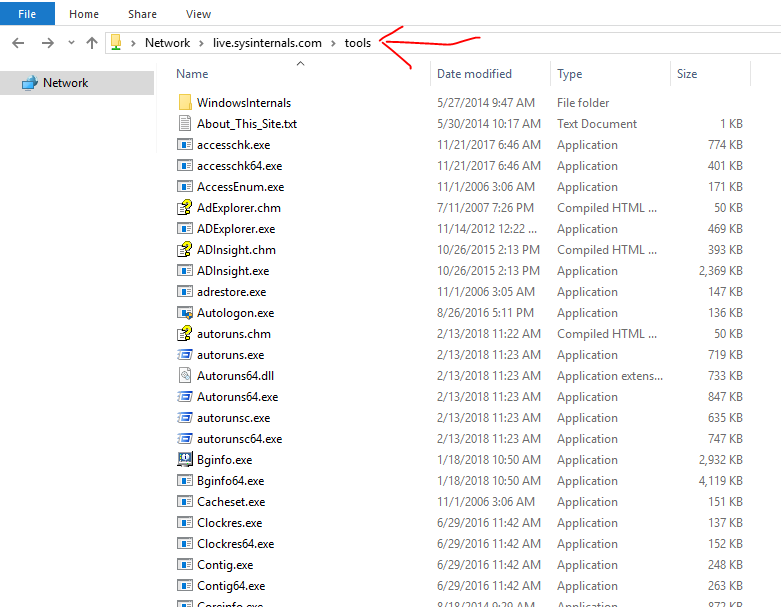
The set of tools is now available on any Windows computer by opening \\live.sysinternals.com\tools\ in file explorer. This UNC path is a service provided by Microsoft and is referred to as Sysinternals Live.
Starting Process Monitor
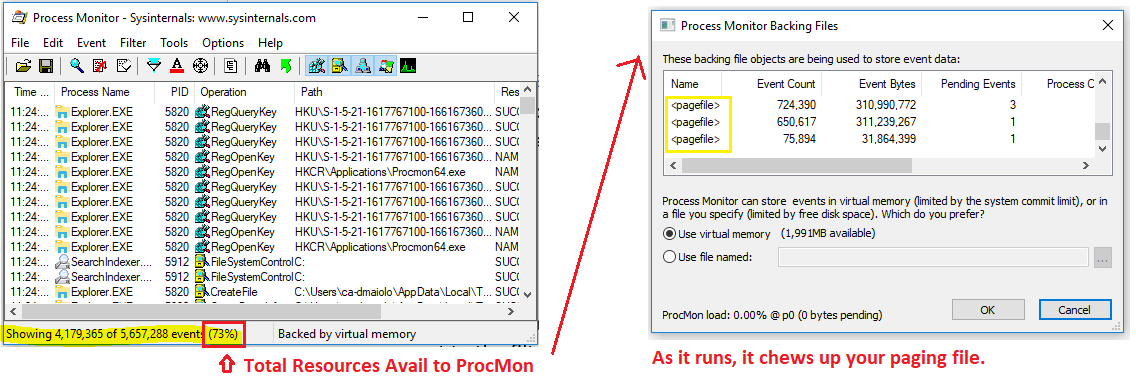
You must run ProcMon.exe from an elevated command prompt, so that it opens in administrative mode as it needs to install Filter Drivers. As soon as you start it, it will begin capturing, and quite quickly will start taking space from your paging file. Therefore, only run it for the necessary time as leaving it running will likely cause your computer to crash unless you run it to Drop Filtered Events against a certain filter. More on this under Filter Process Monitor
Filtering with Process Monitor
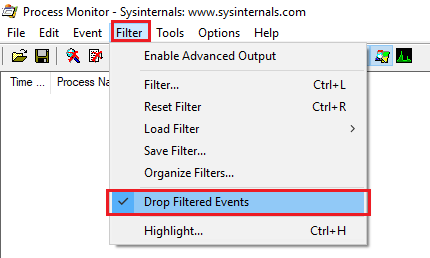
ProcMon can be run for days if you chose to have it filter for a certain type of event. Start by selecting Filter -> Drop Filtered Events.
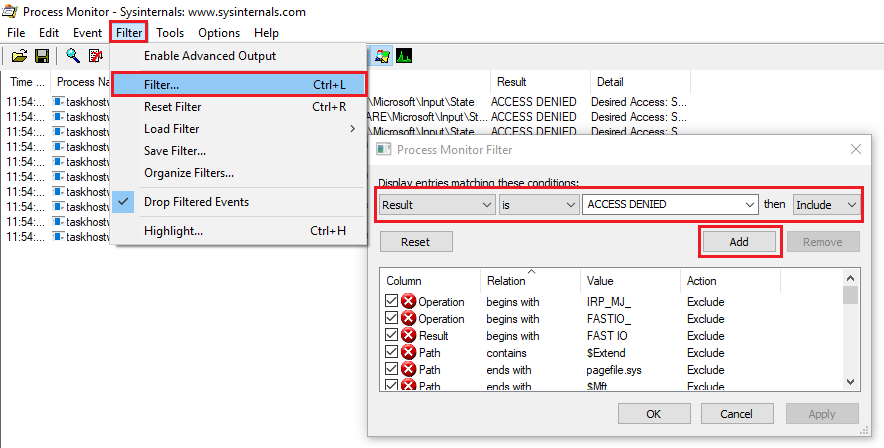
Choosing this option means that only what is filtered will be saved to the log file, as opposed to only filtering will filter what you see, but will log all to the log file. Now, filter to only view processes where the result is Access Denied by opening Filter -> Filter:
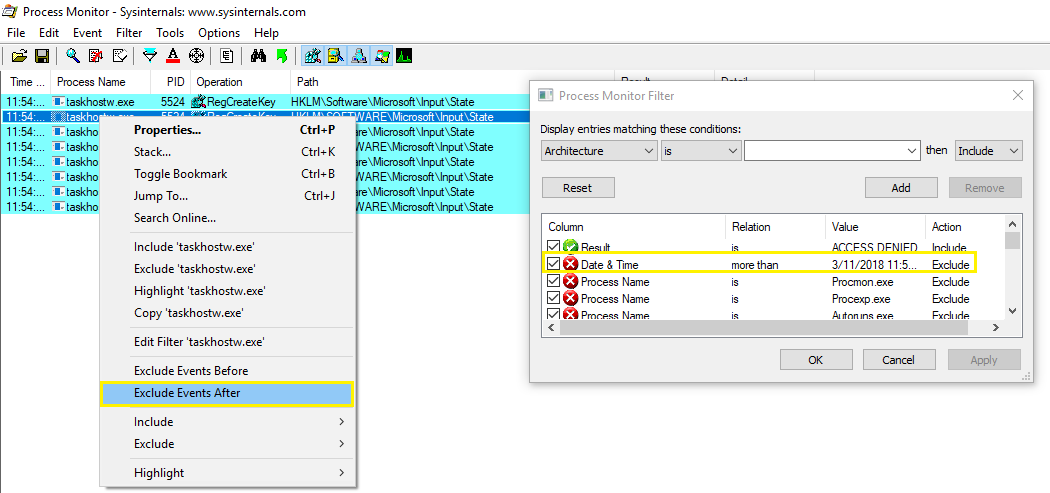
You can also filter right from the main console by selecting a Process, right clickign and choosing one of the filtering options. For example, if we choose to Exclude Events After this event, we can also see that it automatically creates a filter for this choice which we can choose to remove later.
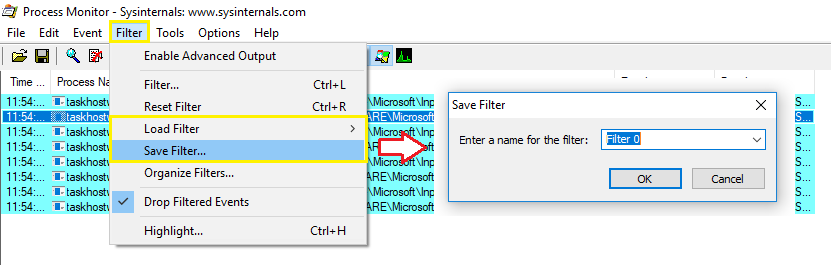
Once you have a specific filter set that might be useful for a certain troubleshooting task, you can choose to Save or Load the filters under the Filter menu:
Advanced Filtering with Process Monitor
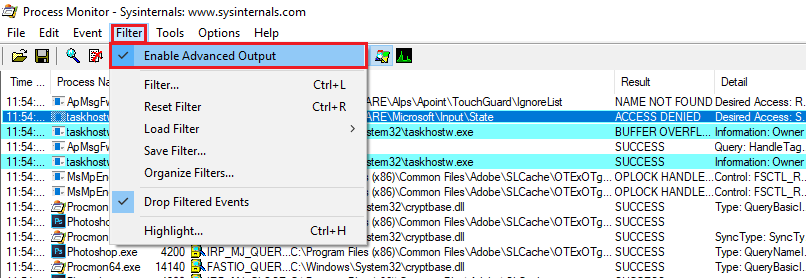
In some instances, you may want to view all events, including those by default that are filtered out of ProcMon. You could opt to manually remove all of the built in filters, but an easier way to do this is to simply select Filter -> Enabled Advanced Output
How to Find Changed Values
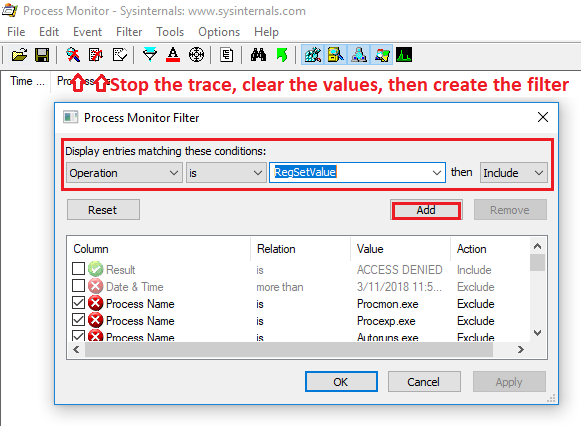
Some people will use ProcMon to try and see what changes a process makes, but it can become daunting. An easier method is to try and utilize ProcMon in a way where you can filter for events happening. Let’s say for example we want to see what registry values are set when we disable Automatic Restart on system failure. To do this, first stop and clear the trace, then filter ProcMon to only show RegSetValue Operations:
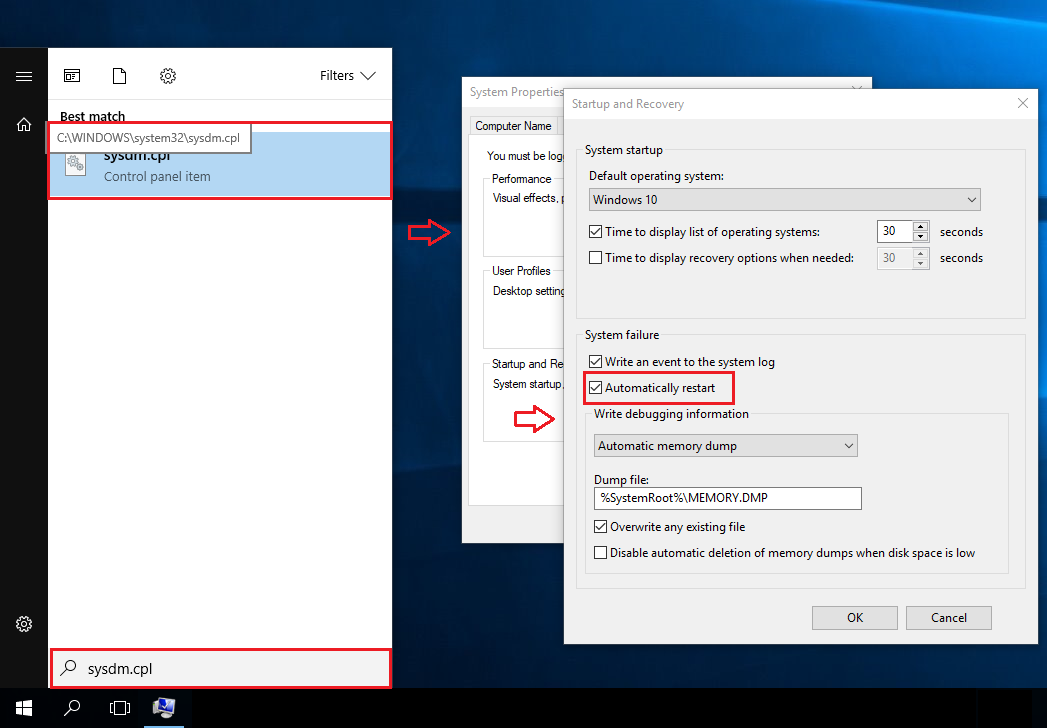
Now, begin the capture and make the desired change:
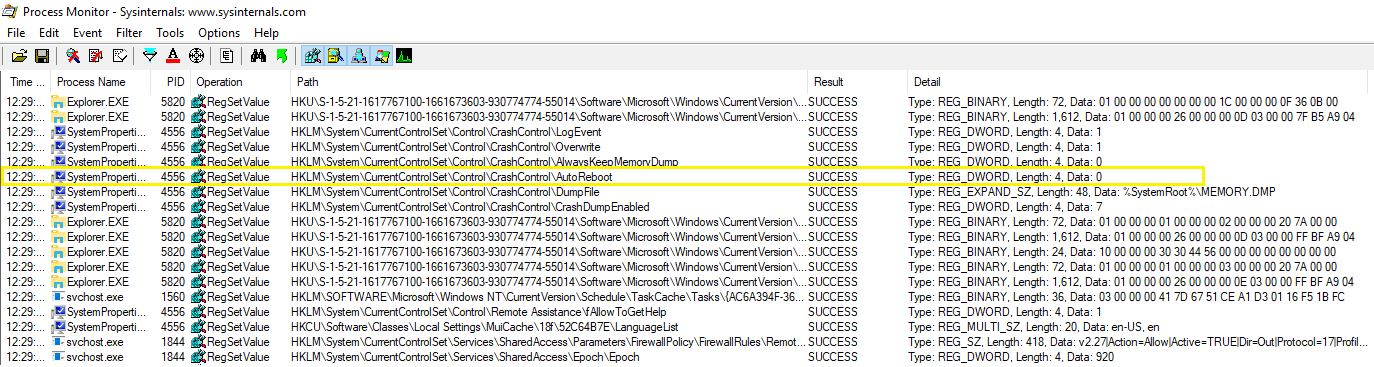
Stop the capture once the change has been made. Now, we can easily see the registry value change that was required to make this change:
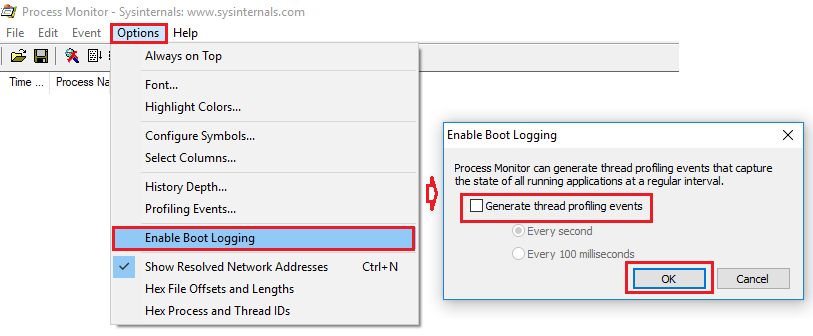
Enable Boot Logging
A very useful feature of process monitor is to trace events during logoff, shutdown, startup and login. There is a special feature to do this ProcMon to do this under the Options menu. Select Enable Boot Logging and then reboot your system. The next time you open ProcMon, you’ll be prompted to save the boot log events to a file.
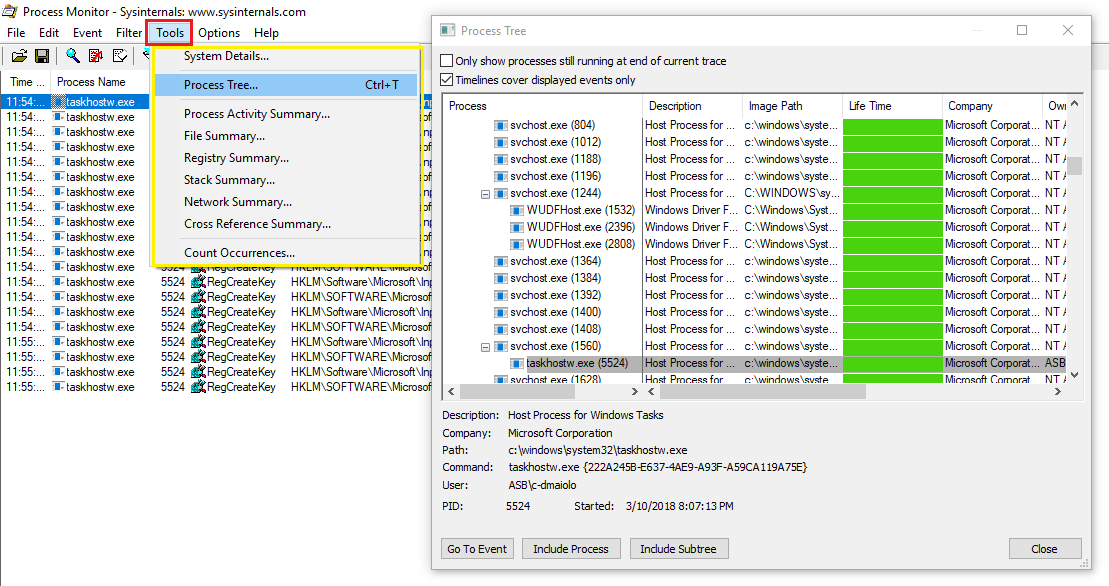
ProcMon Tools: Process Tree
ProcMon has several tools available by selecting Tools from the menu. For example the Process Tree shows you the processes lifetime and how long they lived during the trace.
Running ProcMon against a Remote Machine
Utilizing psexec, 23 can run ProcMon against a remote machine if we do not or cannot be at a remote site for monitoring.
To start the trace on a remote computer run:
Psexec \\ /s /d procmon.exe /accepteula /quiet /backingfile c:\hostname_trace.pml
Now, to stop the trace on the remote computer run:
Psexec \\ /s /d procmon.exe /accepteula /terminate
Finally, copy the log file to your remote machine for viewing:
xcopy \\\c$\hostname_trace.pml c:\TEMP
You can then view the log file in ProcMon locally by running:
Procmon /openlog c:\temp\hostname_trace.pml
ProcMon Filter Drivers
If ProcMon has some issue connecting to the filter driver and gets stuck opening, you can run it to not connect to the filter driver:
Procmon /noconnection
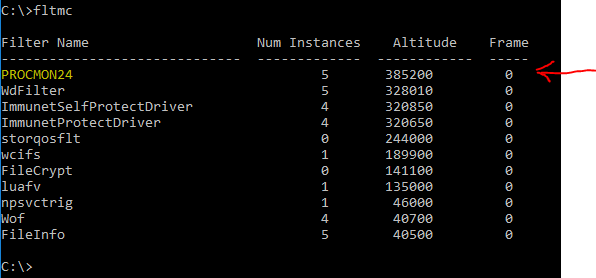
To view the filter driver that is associated to Procmon, run
fltmc